Kubernetes (K8s) 自定義 PHP HorizontalPodAutoscaler (HPA) 指標
此篇要介紹 HorizontalPodAutoscaler 的自定義指標,K8s 內建的指標 (metrics) 只支援 CPU 以及 Memory,如果我們今天想要使用其他的指標來讓 HPA 擴縮呢!? 不知道什麼是 HorizontalPodAutoscaler 嗎?可以先查看:
這時候我們就必須使用自定義指標,我們一樣來說說他的工作原理吧:HorizontalPodAutoscaler 是怎麼取得自定義指標,以及是跟誰拿到指標的呢?我們從下圖得知:
](/kubernetes/gcp-k8s-hpa-php-custom-metrics/1.webp)
HorizontalPodAutoscaler 會先訪問 K8s 的 API,並向 API 取得指標資料。這邊的 API 就是 custom.k8s.io/v1beta1。
大致了解後,我們就來進入今天的重點,也就是透過自定義化 PHP 的指標來讓 HorizontalPodAutoscaler 進行擴縮,這次使用的平台是 Google Cloud Platform,前面介紹 GCP 服務的大家可以參考 Google Cloud Platform (GCP) 百科全書 - 介紹與開頭 [ EP.0 ],我們這邊就直接跳到程式碼與操作部分。
此文章程式碼也會同步到 Github ,需要的也可以去 clone 使用歐! Github 程式碼連結 😆
實作
安裝自定義的 Adapter
我們要先 Apply 自定義的 Adapter,這邊我們使用 Google 提供的 Stackdriver Adapter 來使用 (也可以直接使用 Github 程式碼中的 adapter_new_resource_model.yaml 檔案歐):
kubectl apply -f https://raw.githubusercontent.com/GoogleCloudPlatform/k8s-stackdriver/master/custom-metrics-stackdriver-adapter/deploy/production/adapter_new_resource_model.yamlDeployment
apiVersion: apps/v1
kind: Deployment
metadata:
  name: demo
  labels:
    app: demo
spec:
  replicas: 1
  selector:
    matchLabels:
      app: demo
  template:
    metadata:
      labels:
        app: demo
    spec:
      containers:
        - name: php-fpm
          image: php:fpm
          workingDir: /var/www/service
          ports:
            - containerPort: 9000
          resources:
            requests:
              cpu: 100m
              memory: 1G
            limits:
              cpu: 100m
              memory: 1G
          volumeMounts:
            - name: application
              mountPath: /var/www/service/
            - name: php-fpm-config
              mountPath: /usr/local/etc/php-fpm.d/www.conf
              subPath: www.conf

        - name: nginx
          image: nginx:alpine
          workingDir: /var/www/service
          ports:
            - containerPort: 80
          volumeMounts:
            - name: application
              mountPath: /var/www/service/
            - name: nginx-config
              mountPath: /etc/nginx/conf.d/

        - name: phpfpm-exporter
          image: hipages/php-fpm_exporter:latest
          env:
            - name: PHP_FPM_SCRAPE_URI
              value: "tcp://localhost:9000/status"
            - name: PHP_FPM_FIX_PROCESS_COUNT
              value: "true"
          resources:
            requests:
              cpu: 10m
            limits:
              cpu: 10m

        - name: prometheus-to-sd
          image: gcr.io/google-containers/prometheus-to-sd:v0.9.0
          ports:
            - containerPort: 6060
              protocol: TCP
          command:
            - /monitor
            - --stackdriver-prefix=custom.googleapis.com
            - --monitored-resource-type-prefix=k8s_
            - --source=:http://localhost:9253
            - --pod-id=$(POD_NAME)
            - --namespace-id=$(POD_NAMESPACE)
          resources:
            requests:
              cpu: 10m
            limits:
              cpu: 10m
          env:
            - name: POD_NAME
              valueFrom:
                fieldRef:
                  fieldPath: metadata.name
            - name: POD_NAMESPACE
              valueFrom:
                fieldRef:
                  fieldPath: metadata.namespace
      volumes:
        - name: application
          emptyDir: {}
        - name: php-fpm-config
          configMap:
            name: php-fpm-conf
        - name: nginx-config
          configMap:
            name: nginx-conf
我來簡單說明一下,這是一個 Deployment,我們在每一個 Pod 裡面都放 4 個 Container,分別是 php-fpm、nginx、phpfpm-exporter、prometheus-to-sd
php-fpm 就是我們要使用的 php,nginx 會提供 9000 Port 讓 phpfpm-exporter 去抓到目前的 Process 數值,最後丟給 prometheus-to-sd,讓他去通知我們剛剛所安裝的 Adapter,就可以透過 API 讓 HPA 知道!聽不太懂嗎?沒關係,幫大家畫了一張圖,請參考下方圖片:

可以看到 Deployment 裡面,我們使用 ConfigMap 來掛載 php 的 www.conf 以及 nginx 的設定檔,那我們接下來就寫一份 ConfigMap 吧!
ConfigMap
apiVersion: v1
kind: ConfigMap
metadata:
  name: php-fpm-conf
data:
  www.conf: |
    [www]
    user = 900
    group = 900
    listen = 9000
    listen.owner = 900
    listen.group = 900
    listen.mode = 0660
    pm = dynamic
    pm.max_children = 150
    pm.max_requests = 300
    pm.start_servers = 24
    pm.min_spare_servers = 24
    pm.max_spare_servers = 126
    pm.status_path = /status
    ping.path = /ping
    ping.response = OK
    catch_workers_output = yes
    request_terminate_timeout = 300
    clear_env = no

---
apiVersion: v1
kind: ConfigMap
metadata:
  name: nginx-conf
  namespace: ian
data:
  nginx.conf: |
    server {
      listen 80;
      listen [::]:80;

      server_name _;
      root /var/www/service/;
      index index.php;

      location / {
        try_files $uri $uri/ /index.php$is_args$args;
      }

      location ~ ^/(status|ping)$ {
        fastcgi_pass                  127.0.0.1:9000;
        fastcgi_index                 index.php;
        fastcgi_param SCRIPT_FILENAME $document_root$fastcgi_script_name;
        include                       fastcgi_params;
      }
    }
這份 ConfigMap.yaml 檔案裡面分成 php-fpm-conf 來放 www.conf,以及 nginx-conf 來放 nginx.conf 檔案,這邊要注意的是 www.conf 記得要加上 pm.status_path = /status,phpfpm-exporter 是透過這個頁面來獲得 Process 數量。
HorizontalPodAutoscaler
apiVersion: autoscaling/v2beta2
kind: HorizontalPodAutoscaler
metadata:
  name: demo-hpa
spec:
  scaleTargetRef:
    apiVersion: apps/v1
    kind: Deployment
    name: demo
  minReplicas: 1
  maxReplicas: 10
  metrics:
    - type: Pods
      pods:
        metric:
          name: phpfpm_active_processes
        target:
          averageValue: 50
          type: AverageValue
    - type: Pods
      pods:
        metric:
          name: phpfpm_idle_processes
        target:
          averageValue: 50
          type: AverageValue
    - type: Pods
      pods:
        metric:
          name: phpfpm_total_processes
        target:
          averageValue: 50
          type: AverageValue
    - type: Pods
      pods:
        metric:
          name: phpfpm_accepted_connections
        target:
          averageValue: 50
          type: AverageValue
這份 HorizontalPodAutoscaler 我們使用的版本是 autoscaling/v2beta2, v2beta1 跟 v2beta2 的設定檔語法有些不同!
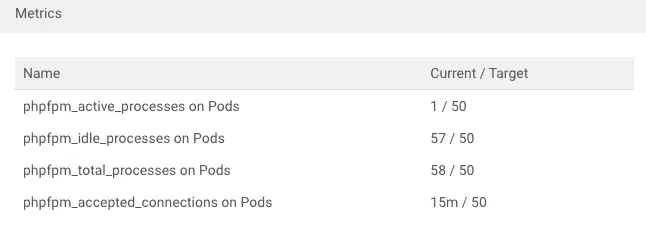
可以看到我們 metrics.pods.metric.name 分別是 phpfpm_active_processes (活動的進程個數)、phpfpm_idle_processes (空閒的進程個數)、phpfpm_total_processes (總共的進程個數)、phpfpm_accepted_connections (當前的連接數量),如果超過我們所設定的 target 值,HPA 就會作動。
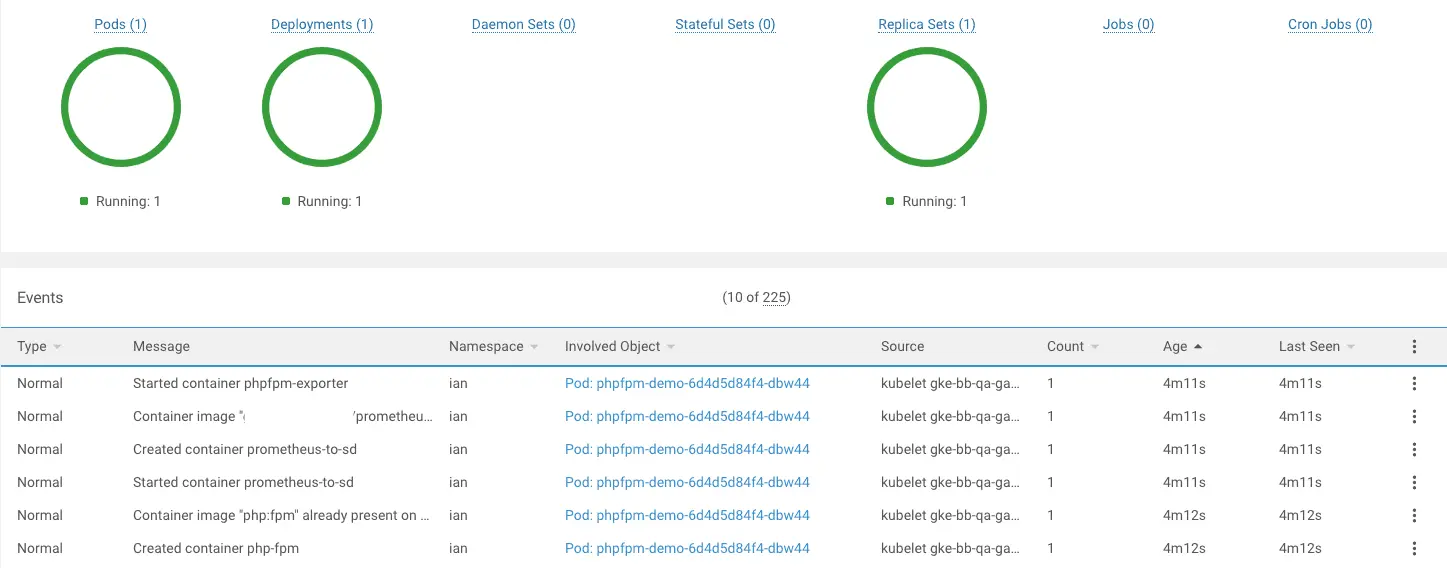
我們依序把 Deployment > ConfigMap > HorizontalPodAutoscaler 的 yaml 檔案給 Apply,可以觀察一下 Pod 是否都有正常啟動:
我們到 HorizontalPodAutoscaler 查看我們所設定的 metrics 是否都有抓到目前的值:
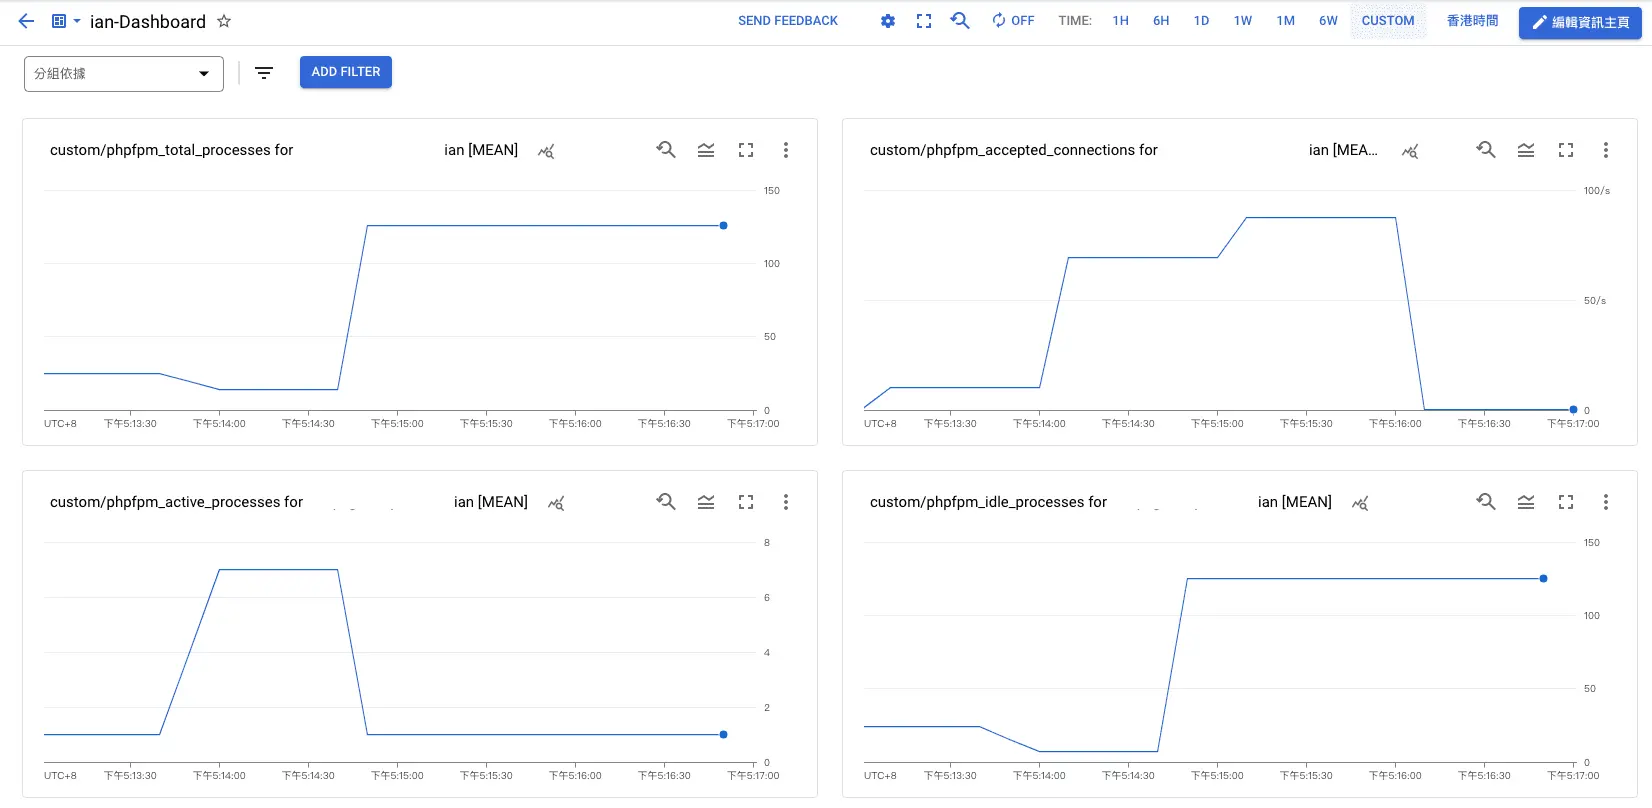
我們也可以用 Google Cloud Platform 的監控來查看:
以上就完成 自定義 HorizontalPodAutoscaler 指標囉~ 😍
參考資料
Autoscaling Deployments with Cloud Monitoring metric:https://cloud.google.com/kubernetes-engine/docs/tutorials/autoscaling-metrics#custom-prometheus_1
GoogleCloudPlatform/k8s-stackdriver:https://github.com/GoogleCloudPlatform/k8s-stackdriver/tree/master/custom-metrics-stackdriver-adapter
hipages/php-fpm_exporter:https://github.com/hipages/php-fpm_exporter
Scaling PHP-FPM with custom metrics on GKE/kubernetes:https://www.ashsmith.io/scaling-phpfpm-with-custom-metrics-gke